Disclaimer: Syntium Algo and all affiliated parties are not registered as financial advisors. The information provided on this site, along with the products and services offered by Syntium Algo, are intended for educational purposes only and should not be interpreted as financial advice. It is important to understand the risks involved in trading and be willing to accept any level of risk when investing in financial markets. Please note that past performance is not necessarily indicative of future results. Syntium Algo and all individuals associated with the company has no responsibility for your trading results or invest decisions. It is recommended to conduct through research, seek professional advice, and carefully consider your financial situation before making any trading or investment decisions.
High-impact Consumer Price Index (CPI) releases and unexpected inflation prints can shatter an account balance in seconds. Standard technical indicators often collapse during these macroeconomic shocks, generating false breakout signals and triggering stop-loss cascades. When inflation numbers deviate from central bank expectations, liquidity thins out rapidly, leaving retail traders exposed to massive slippage and spread widening. Trying to manually navigate these rapid price expansions without structured risk parameters is a recipe for rapid capital exhaustion. You are left fighting high-frequency algorithms designed specifically to sweep liquidity during macro news events. Fortunately, quantitative systems allow traders to harness this market turbulence safely. Inflation Volatility Trading transforms chaotic news spikes into systematic profit opportunities.
The Physics of Macro Inflation Volatility
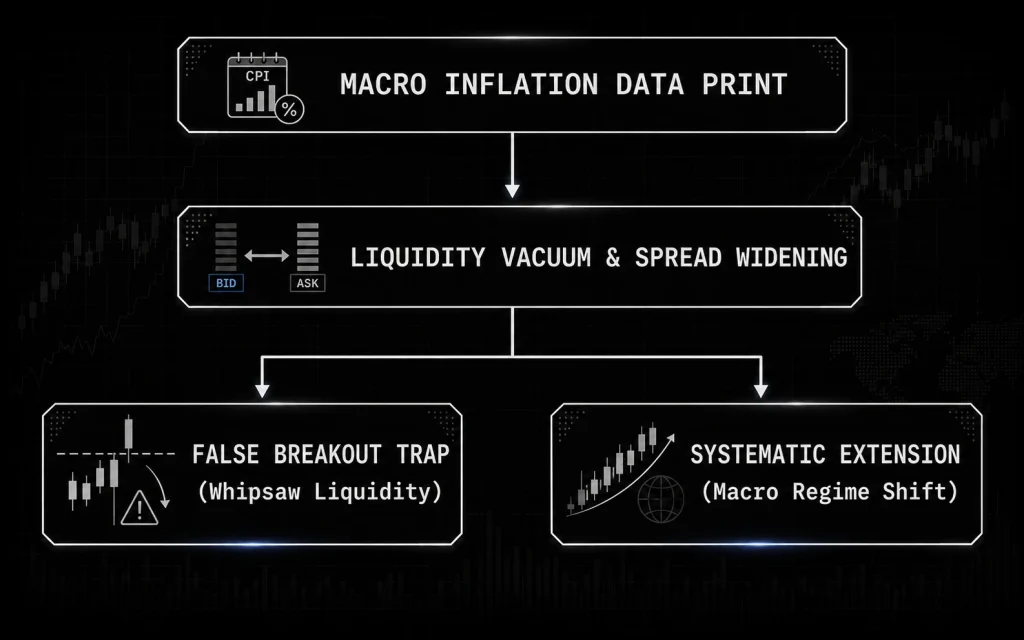
Market behavior changes dramatically when inflation data hits the wire. Understanding the structural mechanics behind these price movements is the first step toward systematic profitability.
Understanding the Liquidity Vacuum
When an economic report releases, market makers pull their resting limit orders to avoid asymmetric risk. This sudden withdrawal creates a liquidity vacuum. As a result, even moderate market orders cause massive price jumps across forex, equity indices, and commodity markets. Inflation Volatility Trading focuses on analyzing this structural order flow rather than guessing macroeconomic outcomes.
The Threat of the False Breakout Whipsaw
Standard indicators often misinterpret initial price spikes as sustainable momentum. Traders enter long or short positions right at the top or bottom of a candle Wick. Moments later, institutional capital sweeps the opposite side of the range, trapping retail traders in severe drawdowns. Tip: Never execute a trade during the first 60 seconds of a CPI release; wait for the initial liquidity sweep to clear before evaluating directional conviction.
- Order Book Thinning: Institutional liquidity providers step back, widening bid-ask spreads.
- Volatility Clustering: High-volatility periods group together, extending turbulent price action for hours.
- Correlation Breakdown: Asset classes that normally move together suddenly decouple during policy shocks.
- Order Flow Imbalance: Aggressive market orders consume thin order books, driving rapid price discovery.
Quantitative Strategies for Inflation Volatility Trading
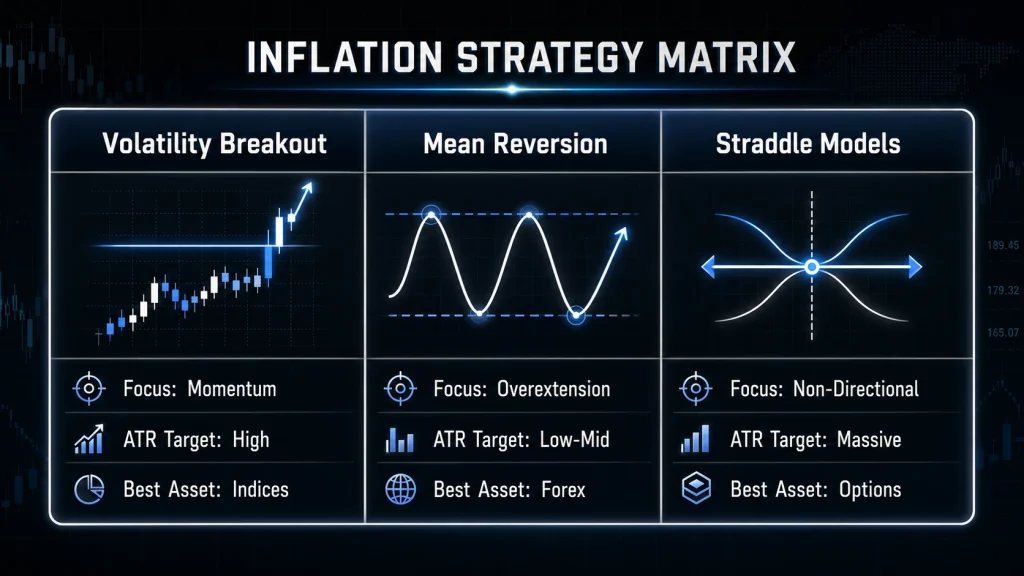
Navigating high-impact economic news requires mechanical execution models that eliminate human emotion. Successful quantitative traders utilize specialized strategies built to handle expanding price ranges.
Dynamic Volatility Breakouts
Instead of using fixed price points, modern breakout models use adaptive boundaries based on the Average True Range (ATR). When price breaks through a dynamic volatility band backed by surging volume delta, the probability of trend continuation increases significantly. This approach ensures you only participate when institutional volume supports the directional move.
Mean Reversion in Overextended Regimes
When inflation data prints near market expectations, the initial price knee-jerk often overreacts. Quantitative engines identify these statistical anomalies by measuring standard deviations from the moving mean. Once the price exhausts its momentum outside the normal distribution curve, mean-reversion algorithms enter positions to capture the return to fair value.
- Volatility Expansion Breakouts: Trading sustained momentum following tight consolidation bands.
- Statistical Arbitrage: Exploiting pricing discrepancies between correlated index futures during news events.
- Options Straddles: Capitalizing on large price swings regardless of final market direction.
- VWAP Bands Reversion: Fading extreme price extensions back toward the Volume Weighted Average Price.
Comparing Strategic Frameworks During High Volatility
To select the right model for Inflation Volatility Trading, traders must evaluate how different frameworks perform under extreme stress.
Evaluating Strategy Performance Metrics
Not all quantitative models handle macro events equally well. Trend-following algorithms capture huge wins during sustained regime shifts but suffer frequent small losses during range-bound chop. Conversely, mean-reversion systems thrive during minor economic updates but face catastrophic risk if an unexpected inflation shock causes a runaway trend.
Strategic Comparison Matrix
The table below highlights how core trading models behave during high-volatility inflation releases:
| Strategy Type | Best Market Regime | Win Rate Potential | Max Drawdown Risk |
| Volatility Breakout | Strong Trend Expansion | 40% – 50% | Moderate (Controlled via ATR) |
| Mean Reversion | Range-Bound Consolidation | 65% – 75% | High (Runaway Trend Trap) |
| Non-Directional Options | Binary Economic Prints | 50% – 60% | Low (Defined Risk) |
| Trend Following | Macro Policy Shifts | 35% – 45% | Moderate-Low |
Signal Integrity: Why Non-Repainting Data is Mandatory
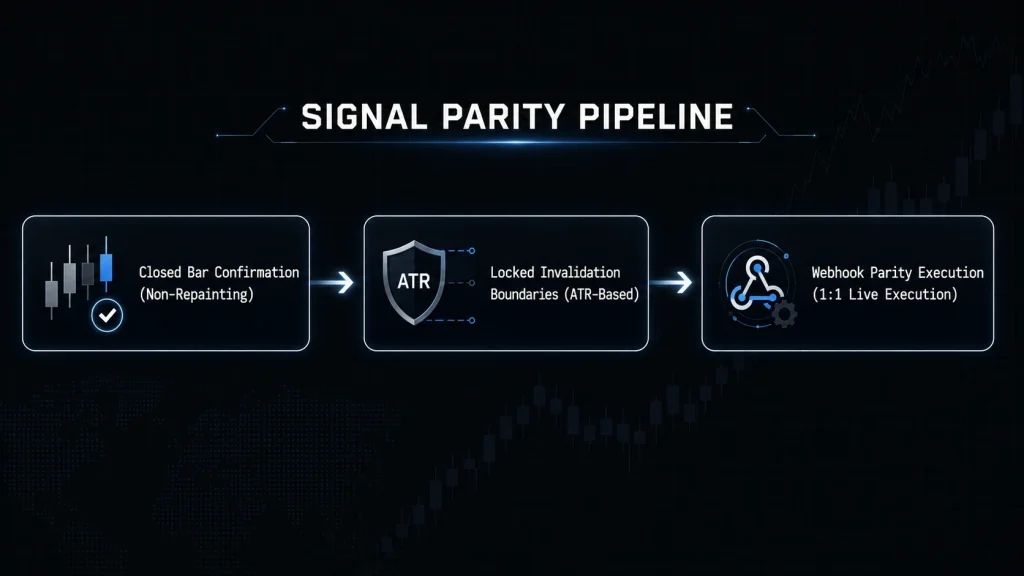
Executing automated strategies during macro news requires absolute data reliability. A single flawed signal can destabilize an entire automated trading engine.
The Danger of Repainting Indicators
Commercial trading indicators often rely on “repainting” logic. They retroactively shift entry arrows or recalculate past historical bars to make backtest results look perfect. However, in live markets, a repainting signal may fire, trigger a live order via webhook, and then disappear from the chart when the market reverses. This leaves your live capital exposed in an unmanaged position without active invalidation levels.
Ensuring 1:1 Execution Parity
To protect your account equity, your trading algorithms must enforce closed-bar execution logic. A non-repainting signal prints only after a price candle completes its timeframe. Tip: Verify that your algorithmic webhooks fire strictly on candle close confirmation to prevent trading on temporary intra-bar price spikes.
Authoritative Reference Suggestions
- Bank for International Settlements (BIS) – Research on market liquidity and foreign exchange execution dynamics.
- Federal Reserve Economic Data (FRED) – Historical Consumer Price Index and inflation volatility tracking datasets.
Algorithmic Risk Management and Drawdown Recovery
Long-term survival in Inflation Volatility Trading is determined by mathematical risk management rather than entry timing.
                     NON-LINEAR DRAWDOWN RECOVERY
   100% ┌─────────────────────────────────────────────────┐
        │                                                *│
    80% │                                               * │
    60% │                                              *  │
    40% │                                        * * *    │
    20% │                          * * * * * * *          │
     0% └─*───*───*───*───*───*───*───────────────────────┘
          10%   20%   30%   40%   50%   60%   70%   80%
                       Loss Percentage
The Non-Linear Math of Drawdowns
When an account suffers a drawdown, recovering back to breakeven requires exponentially higher returns. A 10% loss requires an 11.1% gain to recover. However, a 50% loss requires a 100% gain just to reach your starting balance. Controlling peak-to-trough drawdowns during macro news events is essential to preventing permanent capital damage.
Dynamic Position Sizing with Gaussian Filtering
Traditional fixed-lot sizing fails when market volatility expands dramatically. Advanced quantitative platforms utilize dynamic position sizing scaled against real-time volatility metrics like the Average True Range (ATR). By reducing position size as volatility spikes, your overall capital exposure remains constant, protecting your account from extreme slippage and wide price swings.
FAQs
What is inflation volatility trading?
Inflation Volatility Trading is a quantitative approach focused on capturing price movements driven by inflation reports, central bank rate decisions, and CPI announcements. It relies on systematic indicators and risk controls rather than manual news guessing.
Why do standard indicators fail during CPI releases?
Standard technical indicators rely on simple moving averages that introduce lag or repaint past price bars. During sudden liquidity vacuums, these laggy calculations produce false breakout signals that lead to severe whipsaw losses.
How do non-repainting signals protect my portfolio?
Non-repainting signals lock permanently onto the chart only after a candle closes. This guarantees that your historical backtests match your live automated trade executions 1:1, eliminating unmanaged positions.