Disclaimer: Syntium Algo and all affiliated parties are not registered as financial advisors. The information provided on this site, along with the products and services offered by Syntium Algo, are intended for educational purposes only and should not be interpreted as financial advice. It is important to understand the risks involved in trading and be willing to accept any level of risk when investing in financial markets. Please note that past performance is not necessarily indicative of future results. Syntium Algo and all individuals associated with the company has no responsibility for your trading results or invest decisions. It is recommended to conduct through research, seek professional advice, and carefully consider your financial situation before making any trading or investment decisions.
Navigating moving markets manually often leads to emotional entries, missed opportunities, and improper risk management. An algo trend trading strategy removes the guesswork by using mathematical algorithms to identify dominant market trends and automatically signal high-probability entry points.
With Syntium Algo integrated directly into TradingView, executing a systematic trend-following system requires no coding knowledge. Here is your simple step-by-step guide on how to set up an algo trend trading strategy.
Step 1: Install and Load Syntium Algo onto TradingView
Once you subscribe to Syntium Algo and grant access to your TradingView account, open your target chart (e.g., EUR/USD, BTC/USD, or S&P 500) and load the algorithm onto your workspace.
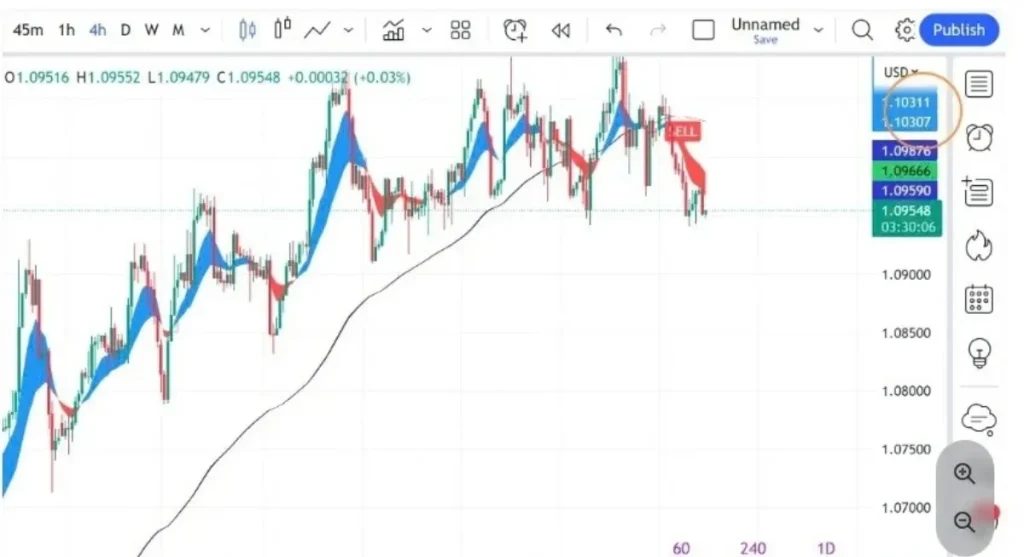
The algorithm instantly analyzes price action, volatility, and trend momentum, rendering real-time BUY and SELL signals right on your main chart canvas.
Step 2: Identify Trend Confirmation and Colored Ribbon Bands
Syntium Algo builds a dynamic trend ribbon that follows the underlying market structure:
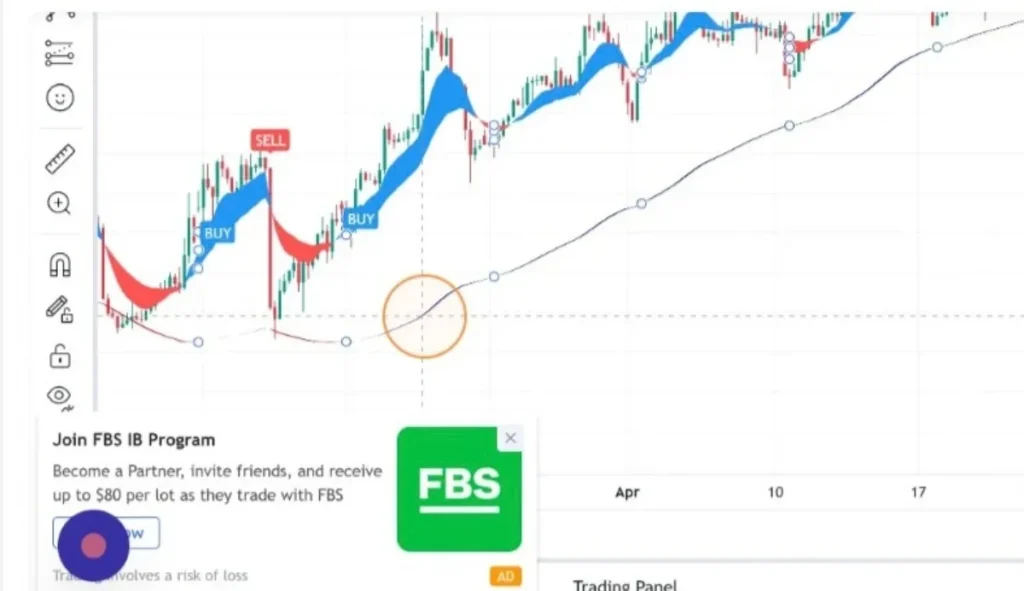
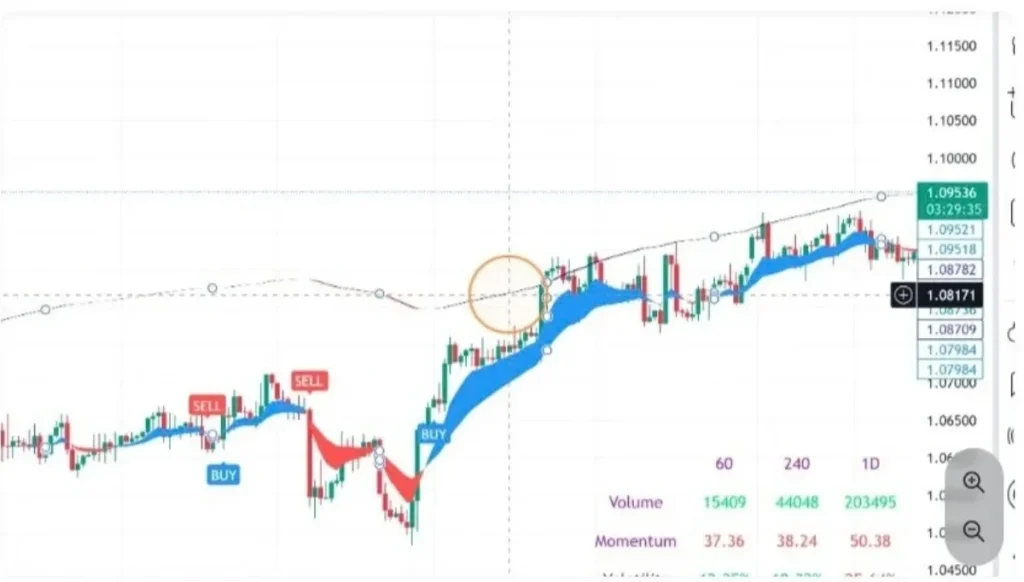
- Blue Trend Ribbon (Bullish Regime): Indicates sustained upward momentum. Look exclusively for BUY signals or pullback entries when the ribbon displays blue.
- Red Trend Ribbon (Bearish Regime): Indicates sustained downward momentum. Look exclusively for SELL or shorting opportunities when the ribbon turns red.
By trading strictly in the direction of the trend ribbon, your algo trend trading strategy filters out low-probability range noise.
Step 3: Read Price Levels on the Right Scale
When Syntium Algo detects an active setup, it projects key operational reference levels directly onto the vertical price scale on the right-hand side.
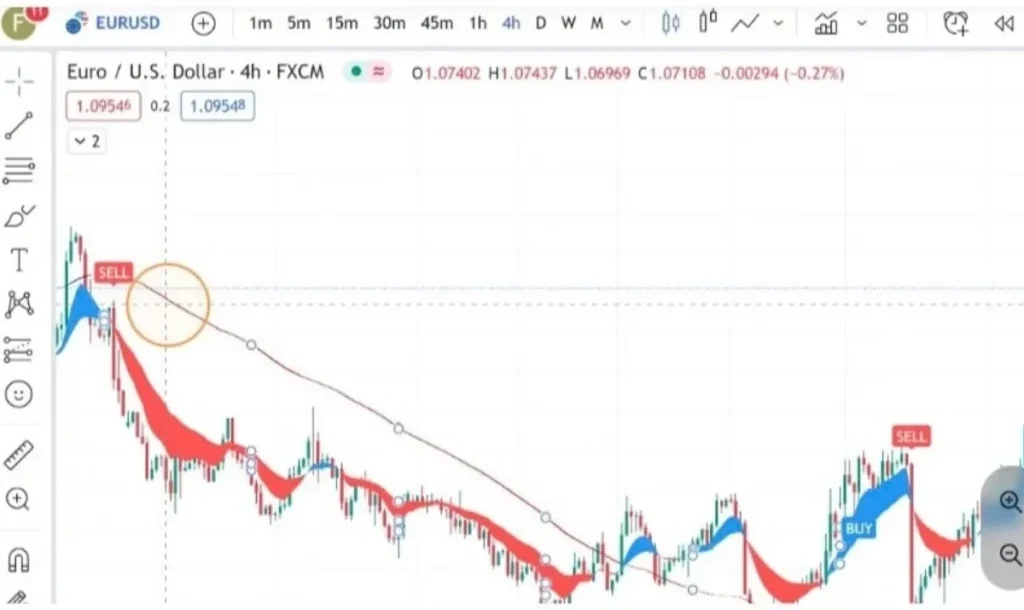
These levels allow you to quickly identify your entry trigger, current market price, and structural key levels for stop-loss and profit-target placement.
Step 4: Execute the Signal and Manage Risk
Wait for Candle Close: Confirm that the BUY or SELL signal remains locked at the close of the current timeframe candle.
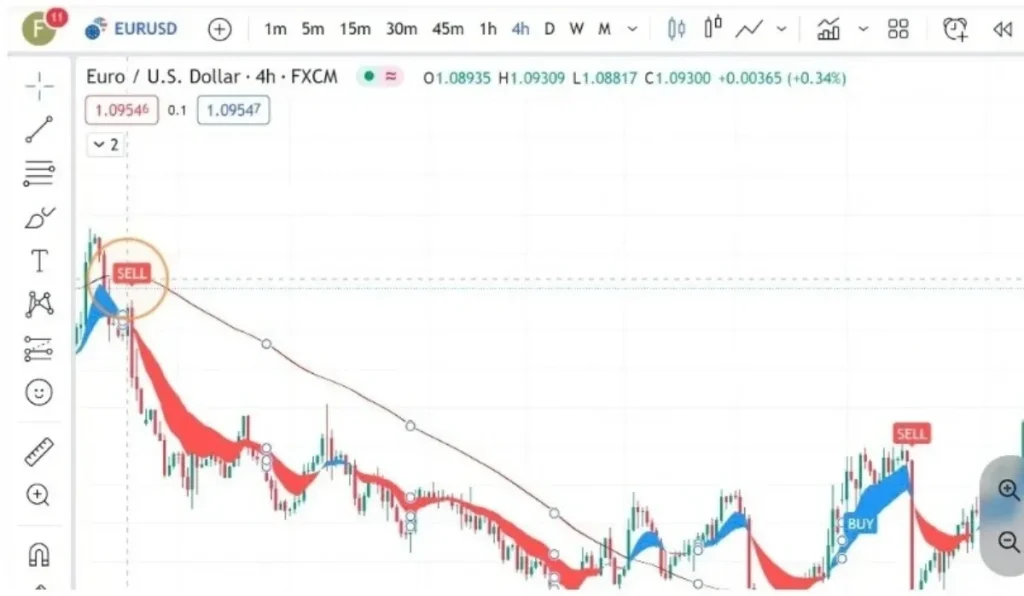
Set Stop-Loss: Place your stop-loss just beyond the opposite side of the Syntium Algo ribbon or past recent structural swing highs/lows.
Set Take-Profit: Aim for a minimum Risk-to-Reward ratio of 1:2 or use the algorithmic targets displayed on the right-hand price scale.
Summary Rules for Syntium Algo Trend Trading
- Align with the Ribbon: Only take BUY signals in a blue ribbon environment and SELL signals in a red ribbon environment.
- Check Higher Timeframes: Confirm that the 1-hour or 4-hour trend matches your lower timeframe entry chart for maximum accuracy.
- Maintain Strict Risk: Never risk more than 1–2% of your account capital on any single algorithmic trade.
FAQs
What timeframes work best with an algo trend trading strategy?
Syntium Algo is adaptive and supports all timeframes. However, standard intraday swing configurations perform best on the 15-minute, 1-hour, and 4-hour charts.
Do I need prior coding knowledge to use Syntium Algo?
No. Syntium Algo operates directly inside TradingView as an overlay indicator. You simply load the tool onto your chart to view automatic visual signals and price zones.
Does Syntium Algo repaint its trend signals?
Syntium Algo delivers non-repainting execution signals once the candle closes, ensuring historical signals accurately reflect live market behavior.